.png)
What is the 'Reports' area on my organization dashboard?
Note: organization-level reporting is an optional feature, and must be enabled for your organization by our team. Please contact support if you are interested in activating this feature.

If you have 'Cross-Event Reporting' enabled for your organization, you will see the following tab available on your Organization Dashboard. This area allows you to create custom reports for your organization, covering all events that are in a draft, active or archived status.
How do I create a new cross-event report?
To begin creating a new cross-event report, select the green 'New Report' button on the page. You will then be presented with the following form:
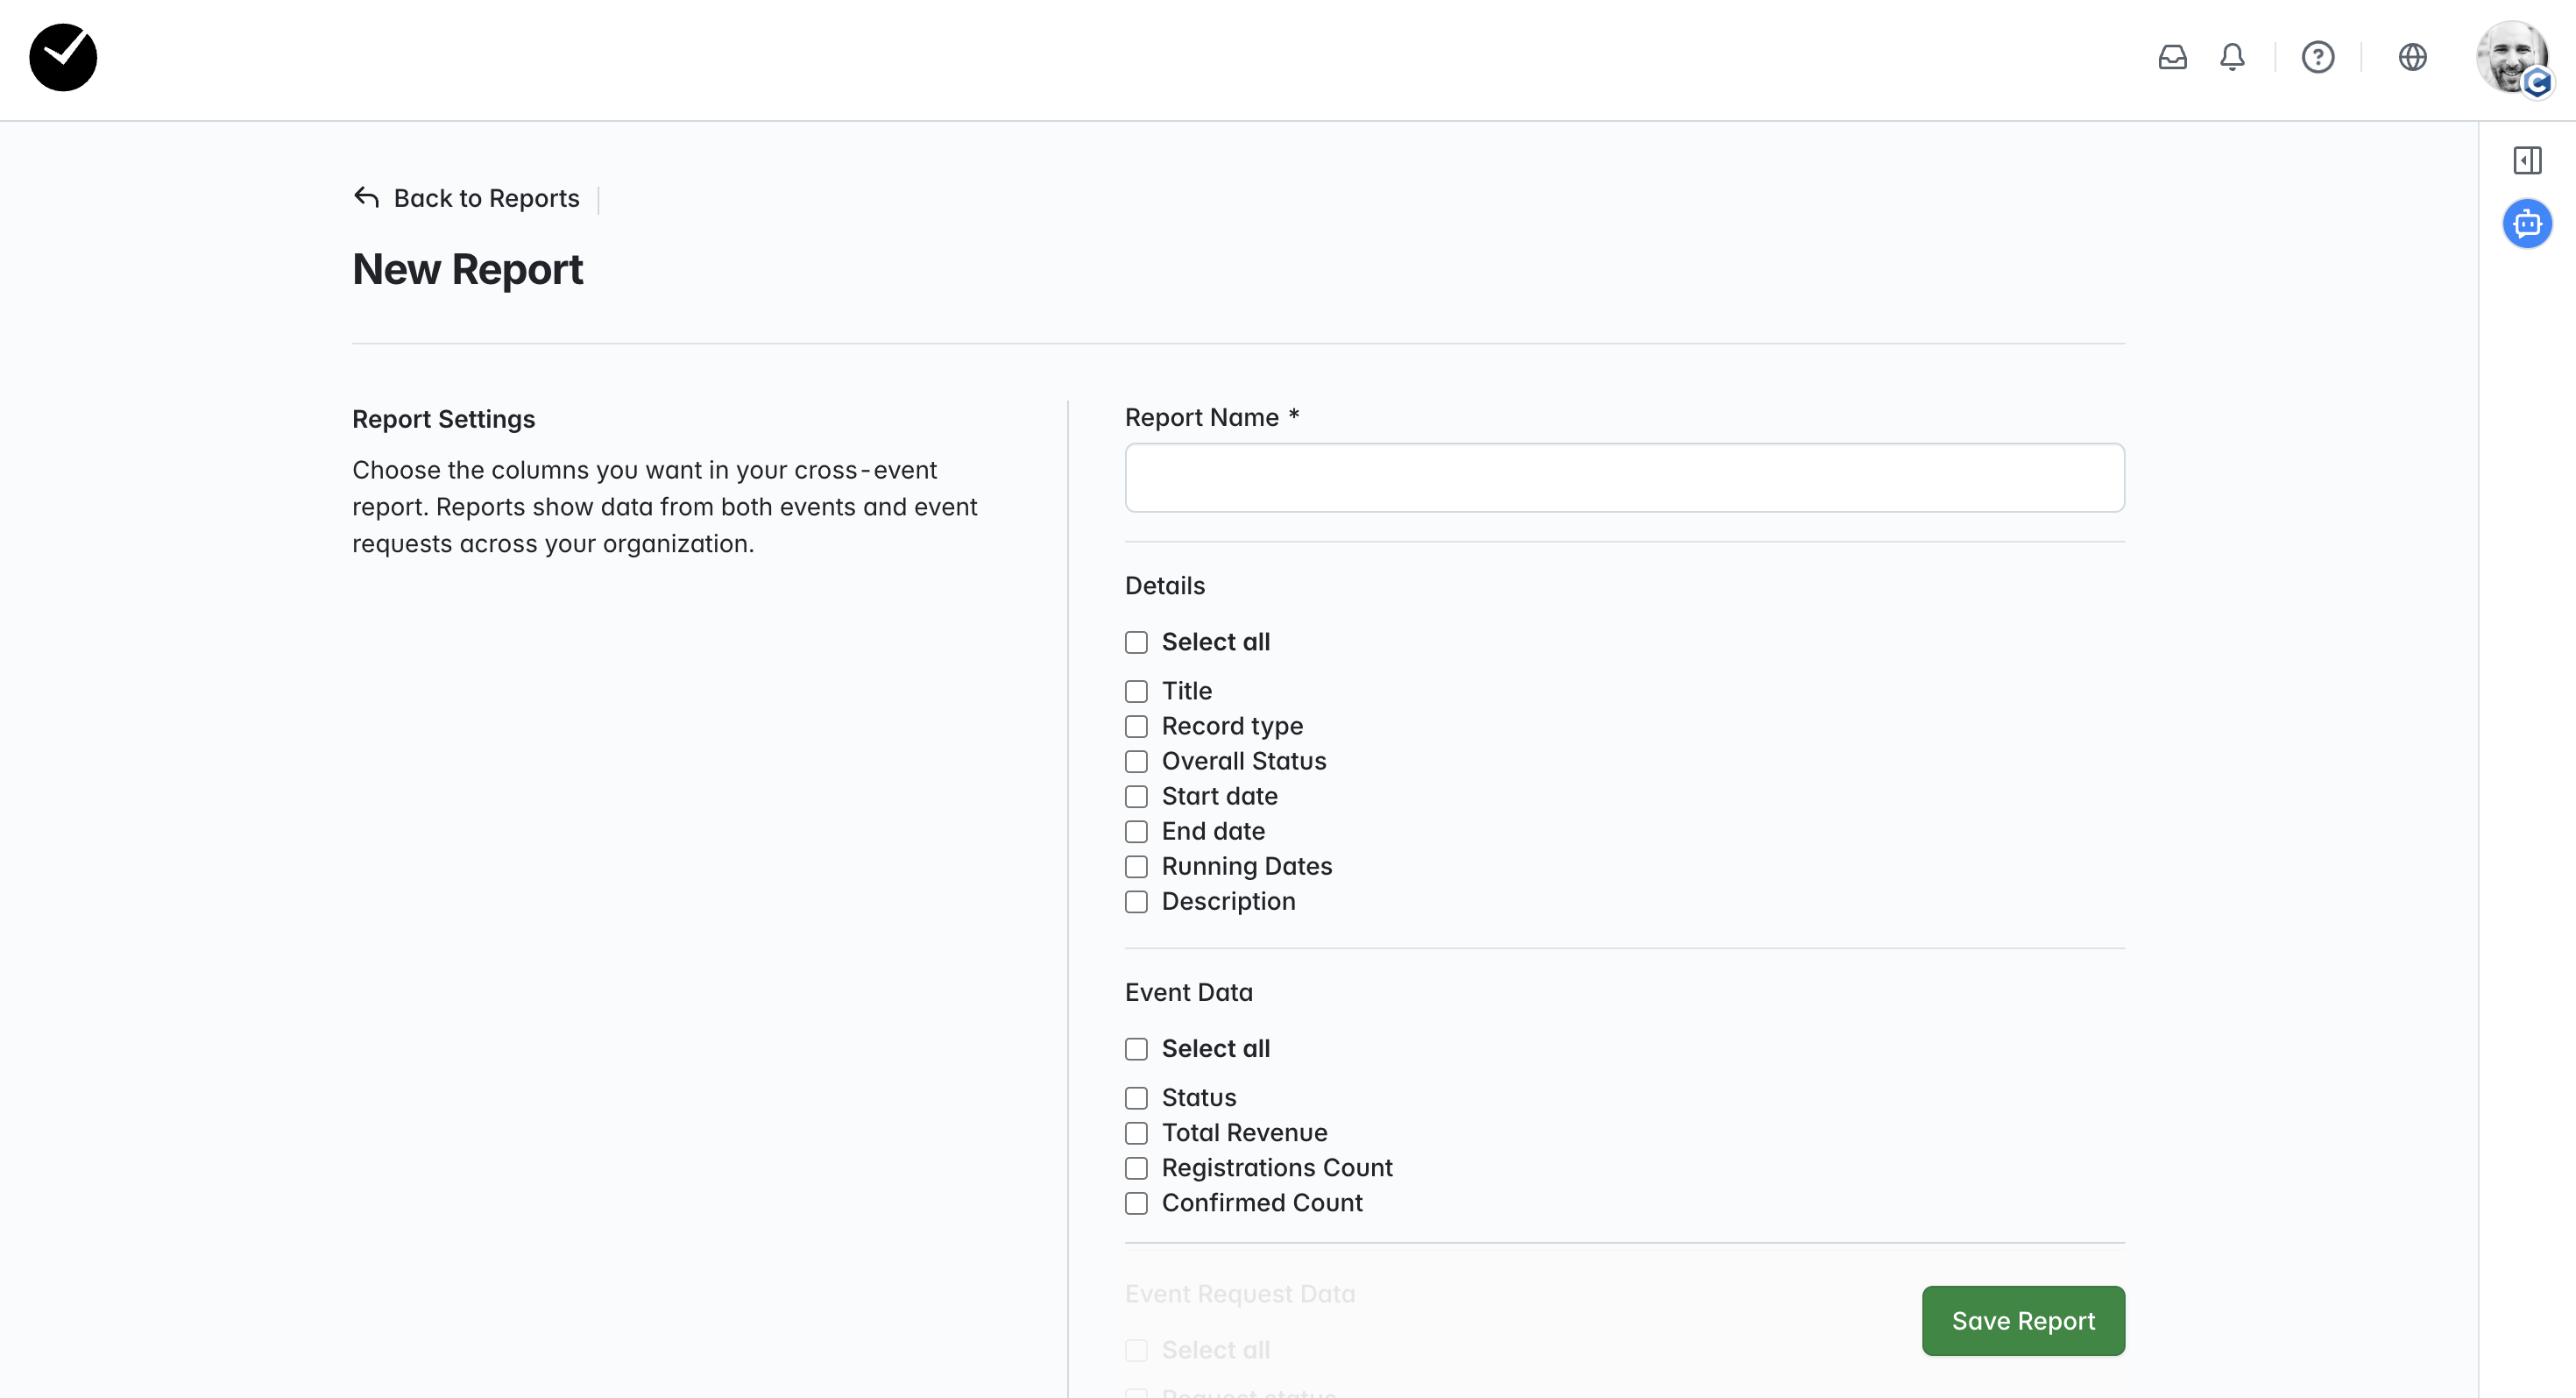
In here, you will give your report a name (this is required), and then select the data you wish to be captured in your report. When creating a new report, you will have the following options available for selection:
- Details - select the high level details from your events/event requests to be captured in your report, such as the title of the event/event request, start/end dates or 'record type' (Event/Event Request).
- Event Data - select the core event data you wish to capture, such as event statuses, registration counts, total revenue etc.
- Event Request Data - similar to the above, select what event request data you wish to capture, such as request statuses, expected attendance and any notes captured during the event request's cycle.
- Invoicing - select to capture your invoice statuses and totals per event/event request for your organization.
- Facilities and Catering - select to capture facility data in your organization report, such as equipment totals, venues, or facilities booked.
- Custom Fields - select to capture any data collected from custom fields in your organization's event requests. These fields are found on the initial page of your event request wizard when creating an event request.
- Timestamps - select to capture any pertinent time stamps such as submission or creation dates.
When you have selected your options and are ready to proceed, click on the green 'Save Report' button. You will then be taken directly to the new report, eg:

How do I view and manage my cross-event reports?
To access your cross-event reports at any time, just enter the 'Reports' tab on your Organization Dashboard. Any reports you have access to will be listed here:

To view any report, click on either the arrow icon (>) next to the report you wish to view, or select 'View' from the menu under the 3 dots displayed at the end of the row for the report you wish to view.

To edit or delete, click on the 3 dots inline with the report row and select the action you wish to take.
When viewing a report, you will see the following:
The main report grid can be sorted and filtered as desired, with the ability to save or reset any sorts/filtering currently applied. At the top right of the page you will see the option to 'Edit Report' (which will take you to the 'Edit Report' area, where you can adjust the captured data in your report) and 'Report Access'. 'Report Access' allows you to assign other users to be able to view your report - just enter a name or email address into the provided field after selecting the 'Report Access' option and then select to grant them access to your report:

You can also rename and re-order the columns on your report as you wish. Select the 'Manage Columns' option and make your changes - columns can be dragged and dropped in any order, and the column headers can be changed using the 'Update Label' field next tot he column listed on the menu:

To download the current report, click on the 'Download' option and select your preferred file type (CSV/XLSX). This will then generate a report, and when the report is prepared, click on the 'Download Now' message when it is displayed, or select to download from your 'Downloads' tray at the top right of the page.

Is there an easy way to monitor the 'running dates' of my organization's events in my reports?
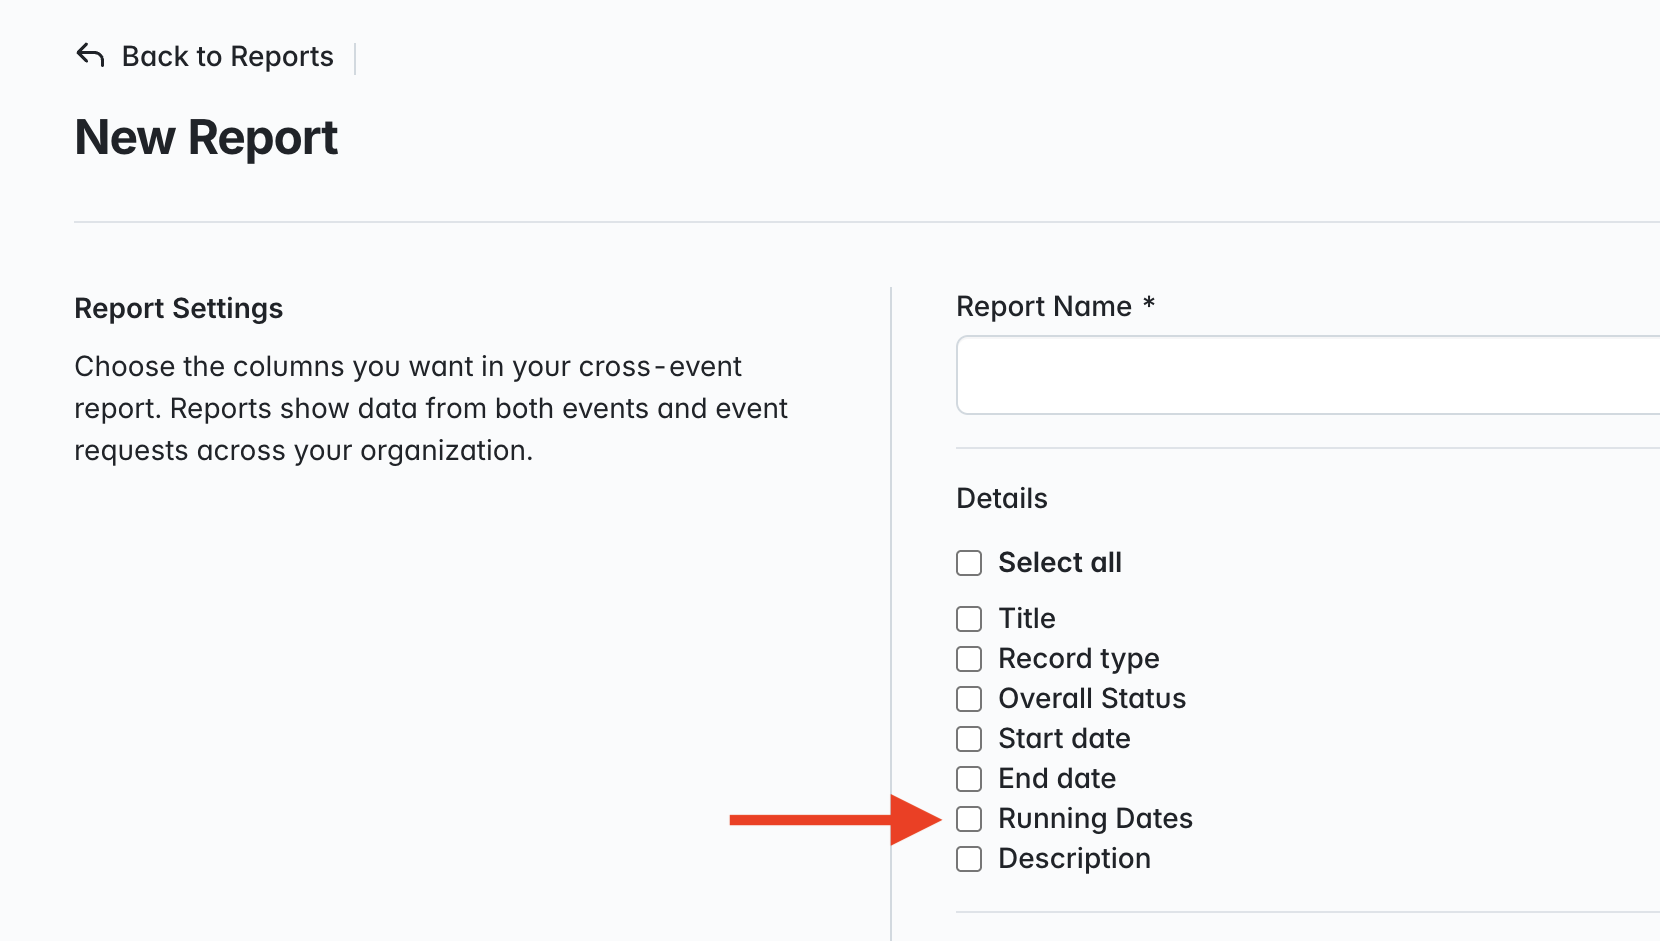
When creating a new report or editing an existing one, by checking the 'Running Dates' option in the first section of your report configuration form, you can add a 'Running Dates' column to your report:
Once you save your report, you will see the following displayed on your report page:
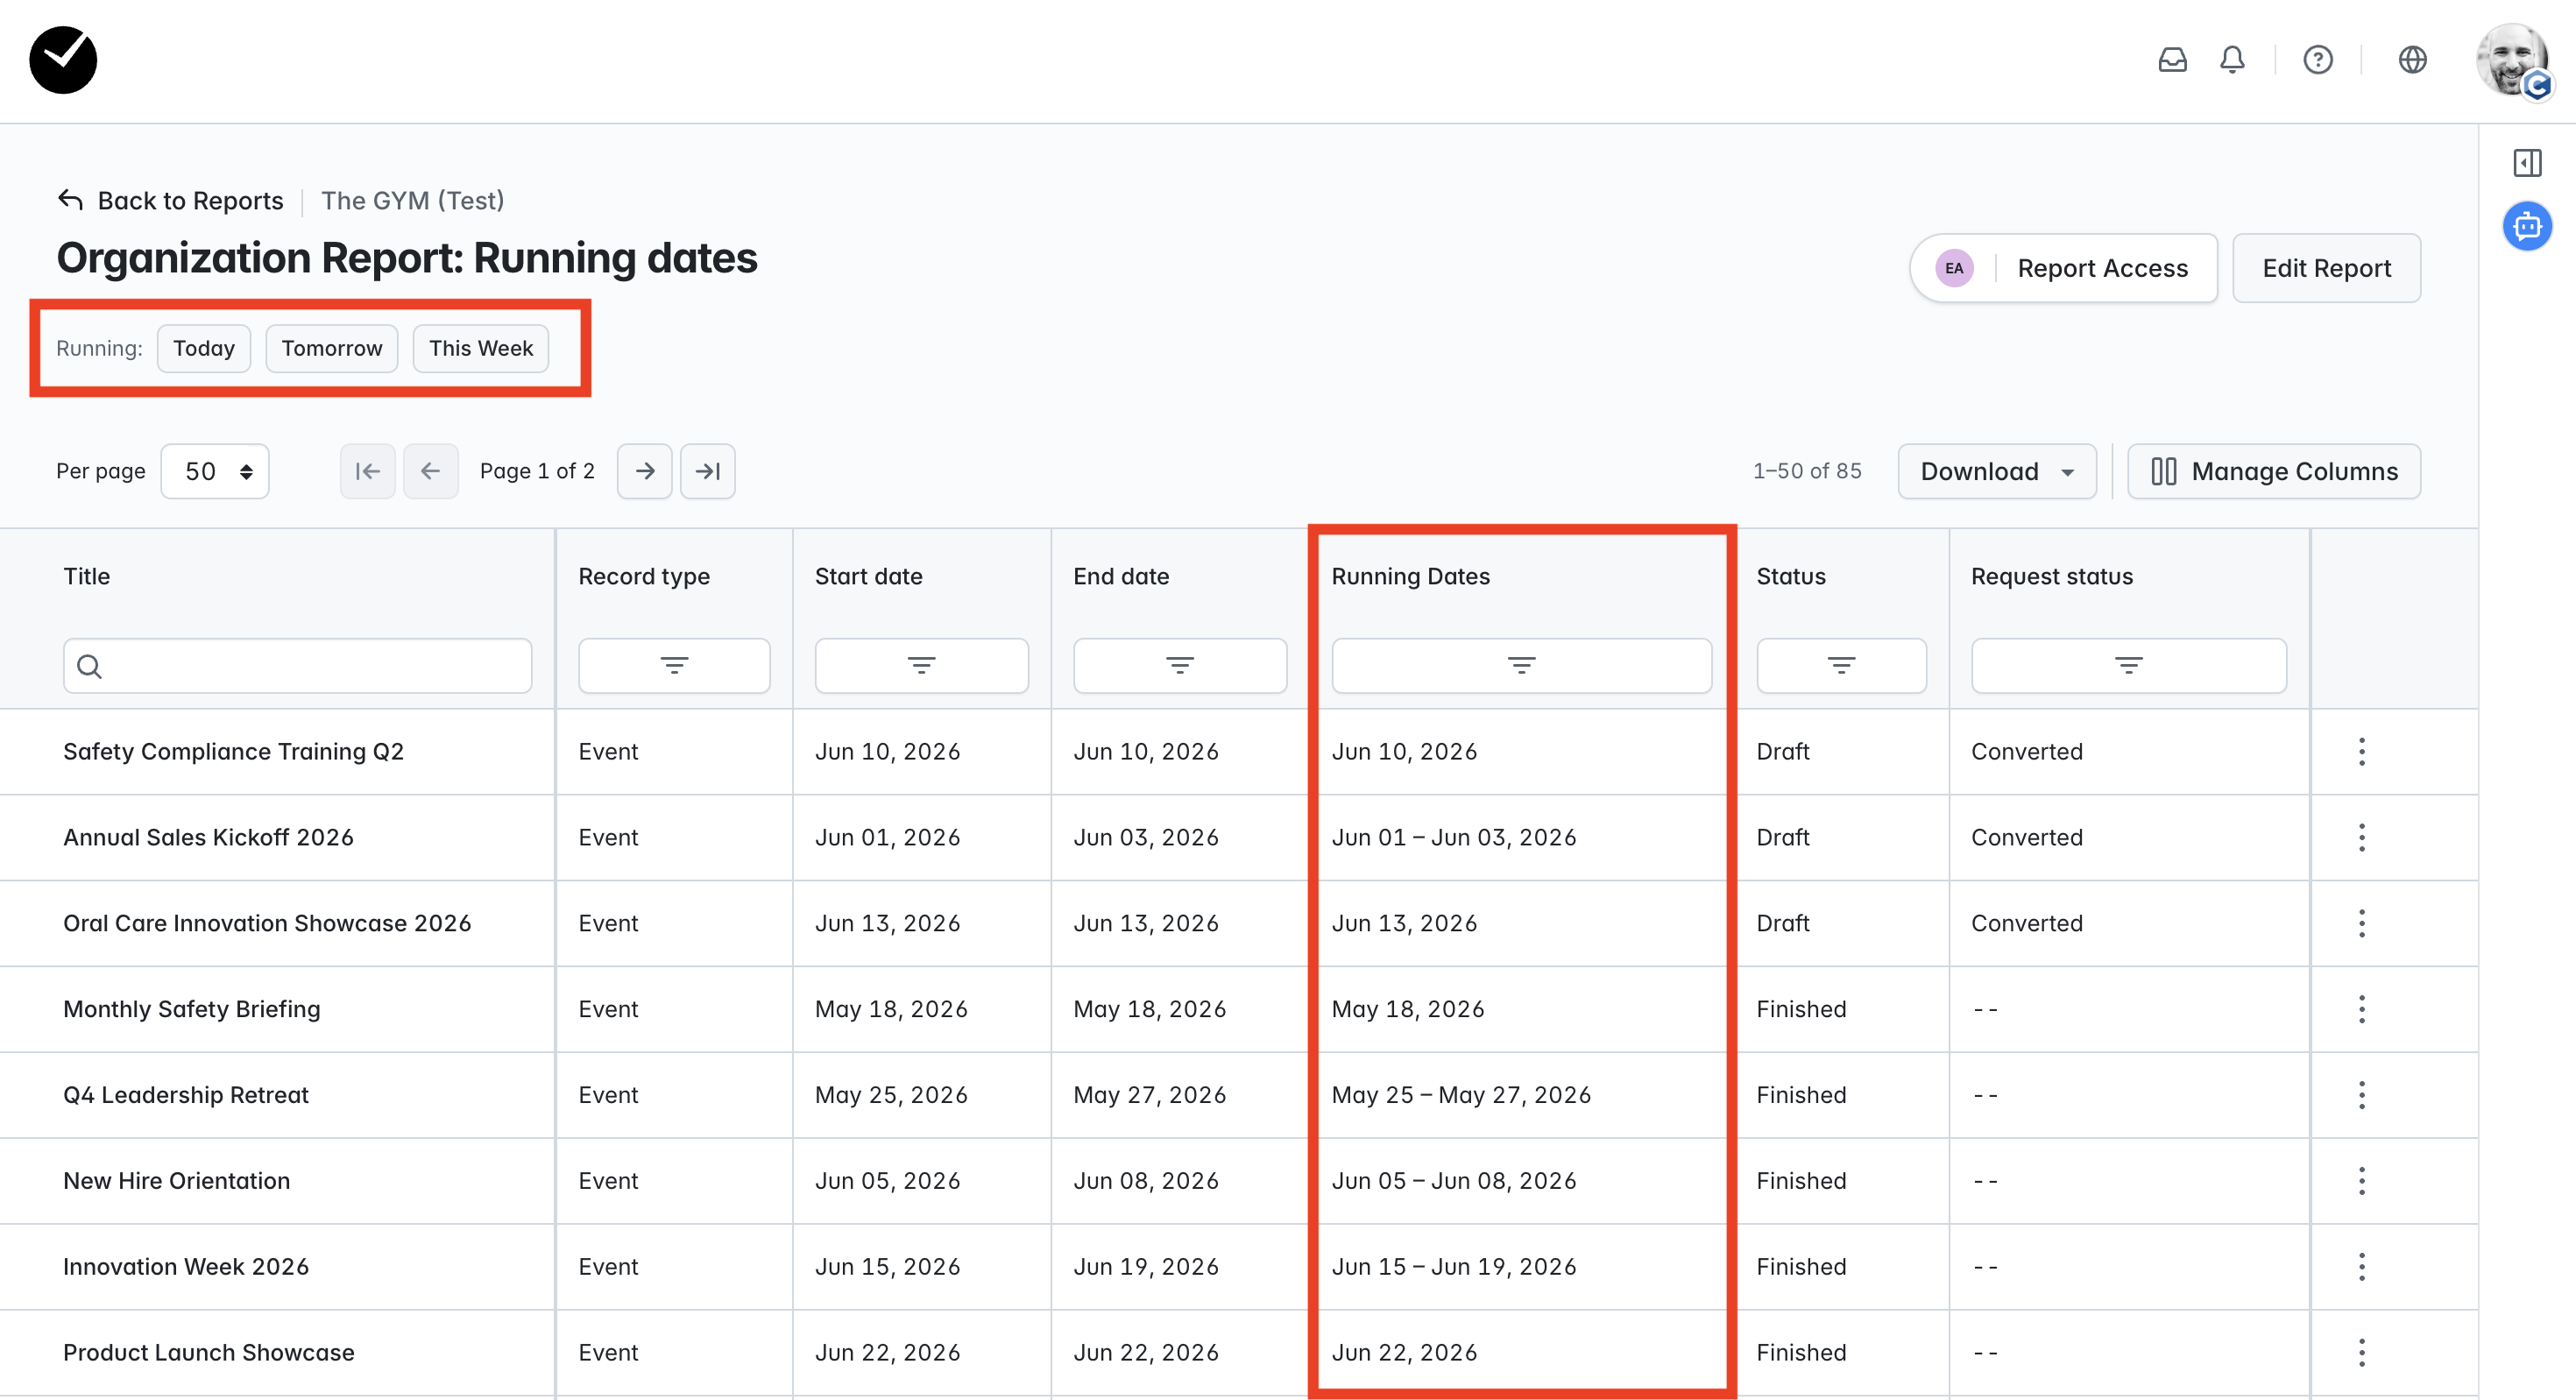
The 'Running Dates' column displays each event's running dates, which can be sorted and filtered as you wish.
At the top left of the page, you can see a set of 'Running' filters - 'Today', Tomorrow' and 'This Week'. These handy options allow you to quickly filter your events without having to enter any dates into the 'Running Dates' column filter, making it quick and easy to see what's happening in the immediate future or right now!